User Guide
Overview
CrustyBase is a repository and analysis suite for crustacean
transcriptome data. CrustyBase relates to two separate datasets:
community datasets and CrusTome datasets. Please see the table
below which summarises the differences.
You can
submit feedback
about additional tools that you would like implemented.
| Community datasets | CrusTome datasets | |
|---|---|---|
| Data import | By users | Curated |
| Expression data | Yes | No |
| Purpose | Various | Annotation, phylogeny |
| Data access | Access levels can be set by user that is uploading | All datasets are fully accessible |
| Relevant tools | BLAST, Extract, Data browser, Domain search | CrusTome BLAST |
Community datasets
Community datasets consist of assembled transcriptomes and gene
expression data for a particular species, across a set of samples.
There are currently 40 community
datasets, but anyone can add to this in the future by uploading
their own. Users can make use of Groups to control access to
these datasets.
You can access these datasets through the following tools:
BLAST, Extract, Data browser, Domain search
CrusTome datasets
CrusTome is a curated database of 201 assembled transcriptomes
from a taxonomically comprehensive range of Pancrustacean species.
The transcriptome assemblies in this database were produced using
a consistent methodology and processed to remove microbial
contamination and redundancy. It provides datasets for sequence
similarity searches, orthology assignments, phylogenetic inference,
etc.
You can access these datasets through the CrusTome BLAST tool.
Datasets
Datasets have been structured to provide as much information as possible for each transcriptome.
Metadata
Each dataset is described by a structured array of metadata.
For community datasets, this will include information like
taxonomy, experiment description and assembly procedure. It can
also include a reference to a publication so that the dataset
author can be easily cited, which we strongly encourage if you
find a dataset useful. You can view the metadata for a community
dataset on its profile page in the
data browser.
For CrusTome databsets, metadata includes fields such as
taxonomy, sampling condition, keywords, and NCBI SRA/TSA
accession.
Transcript data
Each dataset has a number of data types corresponding to each transcript. Some of these are rendered in a graphical display as you browse through transcripts in a BLAST result, and all of them are available to download in some form.
Data types relevant to transcripts from community datasets are summarised in the table below.
| Data type | Description | Rendered in output | Available for download |
|---|---|---|---|
| Nucleotide sequence | cDNA sequence of the transcript. This sequence is the origin of all other data types. | Only as alignment | Yes, full access required |
| CDS sequence | Coding DNA sequence predicted by TransDecoder. | No | Yes, full access required |
| Peptide sequence | Protein sequence predicted by TransDecoder. | Only as alignment | Yes, full access required |
| Expression data | Mean expression level across experiment features | Yes | Yes, full access required for raw data |
| Conserved domains | Conserved protein domains predicted by CD-search | Yes | Yes, graphics only |
Data types relevant to transcripts from CrusTome datasets are summarised in the table below.
| Data type | Description | Rendered in output | Available for download |
|---|---|---|---|
| mRNA sequence | mRNA sequence of the transcript. This sequence is the origin of all other data types. | Yes | Yes |
| Amino acid sequence | mRNA sequences were translated to amino acid sequences. | Yes | Yes |
| Conserved domains | Conserved protein domains predicted by CD-search | Yes | Yes, graphics only |
Data browser
While the number of transcriptomes is small, navigating datasets remains quite
simple. But once the database grows, finding a relevant dataset among thousands
becomes challenging. The
browser tool
was designed to efficiently find the community datasets
that are of most interest to you.
You can search for
a particular species, or try any other keyword that is relevant to you.
"Molt", "disease", "virus", "immune" and "brain" should all return related
datasets. You can also search by taxonomy ("portunidae").
Each dataset has a dedicated page describing the species, data
and experimental conditions.
BLAST search
BLAST overview
The BLAST tool is a long-time staple of the bioinformatics
toolbelt. Submit a DNA or protein sequence that you're
interested in and it will give you back the best-matching
sequences in the transcriptomes that you have selected. Learn
more about the NCBI's BLAST tool
here.
In CrustyBase, the BLAST tool is for searching through the
community datasets and allows users to view the expression of the
transcripts found. On the other hand, the CrusTome BLAST tool
is for searching through the CrusTome datasets and provides users
the option of analyzing transcripts in Galaxy for alignment
and phylogeny. The user interface is similar for both tools,
so these instructions apply to both.
Search for a sequence
The BLAST submission form is made up of three simple components:
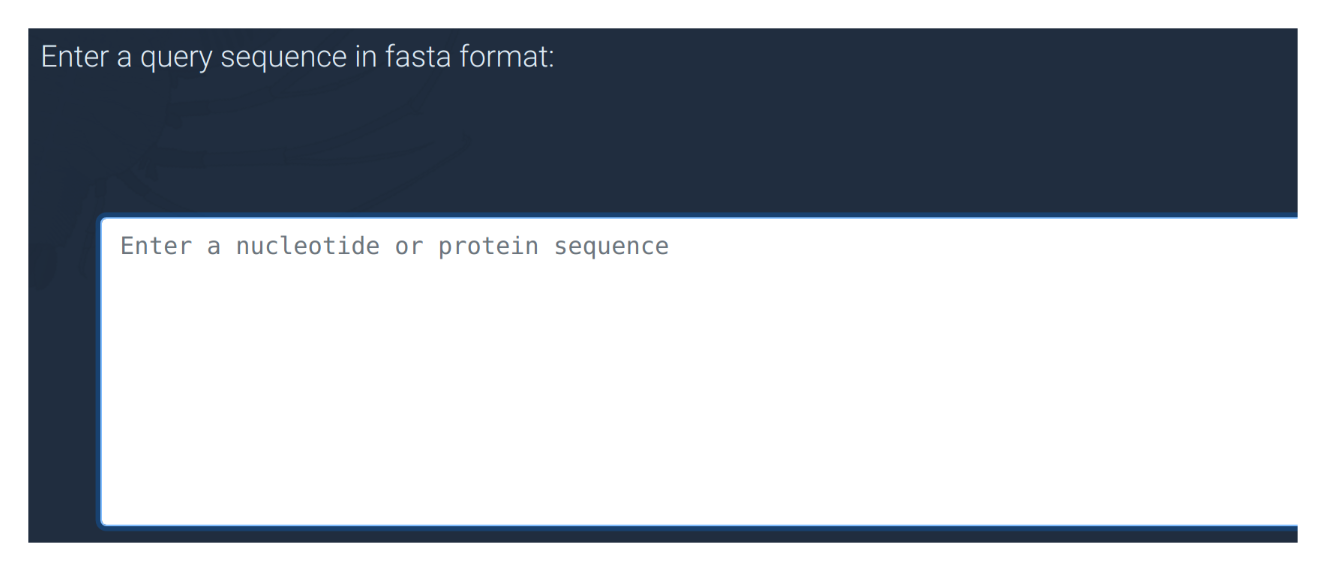
Query sequence input
To conduct a BLAST search you must first find a DNA or protein sequence of a gene that you're interested in. The "sample sequence" button can give you an example if you're just trying it out. Sequences can be obtained from the NCBI website or sometimes directly from published research articles. Copy and paste your sequence into this box to begin. It is worth remembering that protein sequences are usually more conserved than DNA between distant taxa, and are therefore more likely to match your target gene.
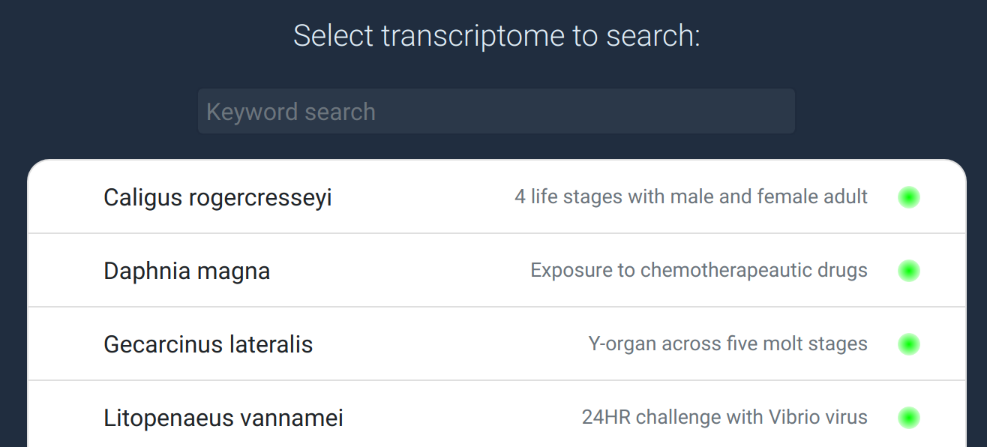
Database list
Select the transcriptome dataset you wish to search from this list. There
may be many databases, but only 10 are shown at a time. To find the
database you're looking for, simply type in some keywords into the
input field above to filter the database list. Try searching with
species or family names, tissues ("brain" or "gill") or other
biological keywords such as "immune", "environment" or "reproduction".
If you want to search and view the community datasets
in more detail, switch to the
data browser. The access
level of each database is shown on the right as a green
(full access) or orange (restricted access) light.
You can add one or many datasets to the "selected" pane before
running the search, but more datasets will of course increase
the run time.
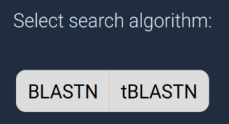
Search algorithm
The search algorithm that you choose depends on the query sequence
that you entered above:
- BLASTN searches nucleotide transcriptomes with a DNA sequence
- tBLASTN takes a protein sequences and searches translated nucleotide sequences on-the-fly. This tends to be more reliable when searching cross-genus and beyond, as protein sequences are almost always more conserved.
Viewing the result
BLAST results
- Datasets with transcripts matching your query are stacked up the page.
- Each dataset in the stack features a species image, experiment description and table summarising the BLAST hits.
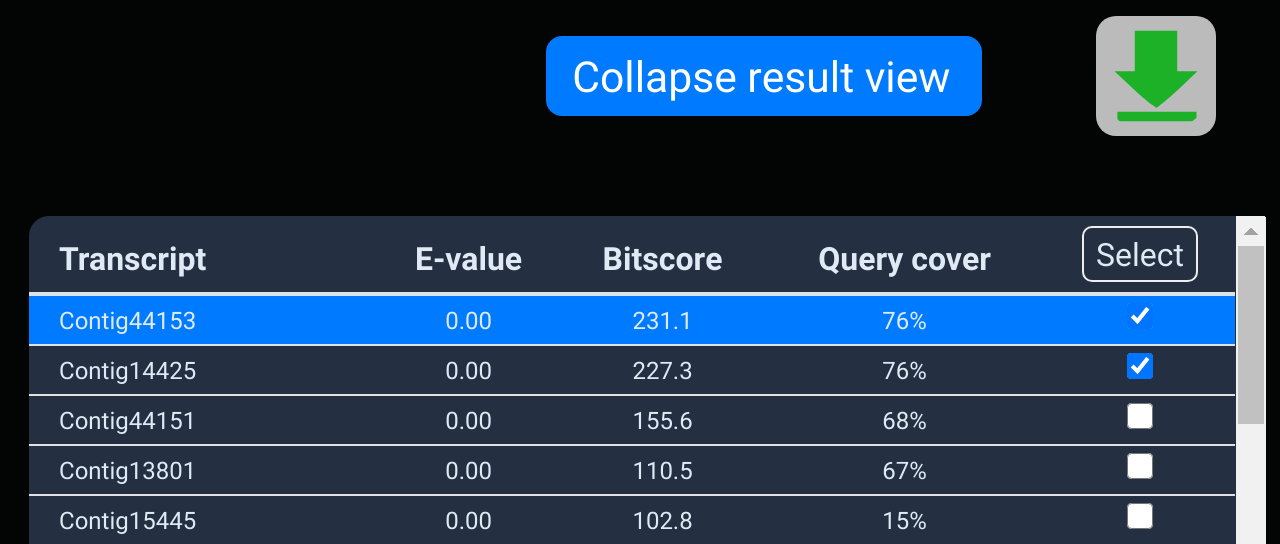
- Select transcripts in the table with the checkbox, and download data relating to them.
- Click "expand" to open up a full-screen view of a dataset's results
- Click or use arrow keys to visualize transcripts in three corresponsing panes
CrusTome BLAST results
- All hits displayed in one large table.
- Select transcripts in the table with the checkbox, and download data relating to them.
- Click or use arrow keys to visualize transcripts in corresponsing panes
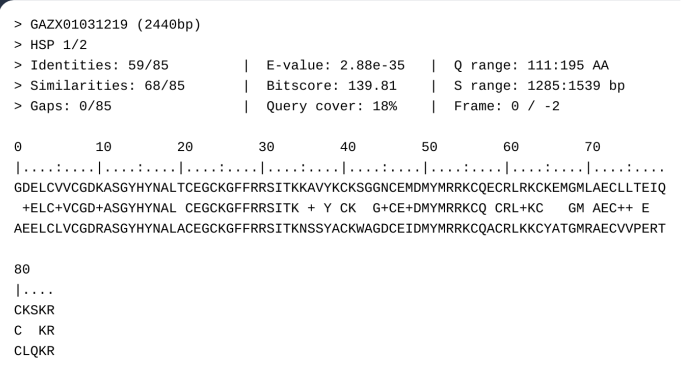
The alignment pane
A conventional alignment out from the BLAST tool is displayed in
the first viewing pane. This shows exactly which residues match
between the query sequence and the selected transcript. Match
statistics are shown above the alignment. One match may return
a number of HSPs (high-scoring pairs).
HSPs are sections of matching sequence. When searching a
transcriptome with protein or cDNA sequence you would normally
expect to find one HSP. Two or more indicates large insertions
or deletions between the query and subject sequence, probably
due to differential mRNA splicing or perhaps a sequencing error.
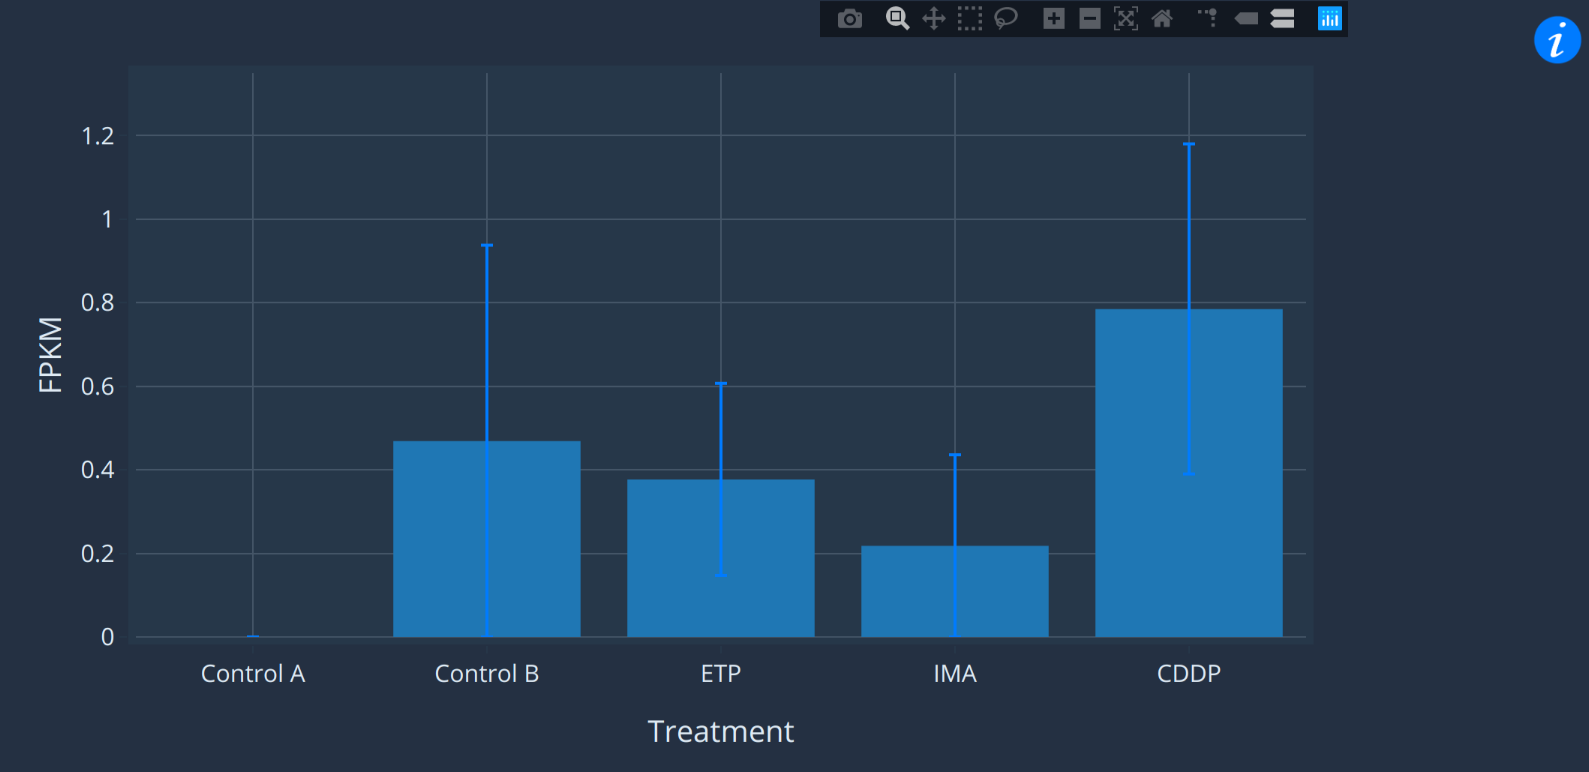
The expression pane
This pane is only shown in the BLAST tool, not the CrusTome
BLAST tool.
The expression pane shows the expression profile of the
selected transcript. Move the cursor over markers on the chart
to see mean and standard error of the data. If you aren't sure
what the x-axis labels mean, try hovering over the info symbol
on the right to see the experiment description. You can also
click-and-drag on the y-axis to increase or decrease scale.
This can be useful for zooming in on low-expressed samples.
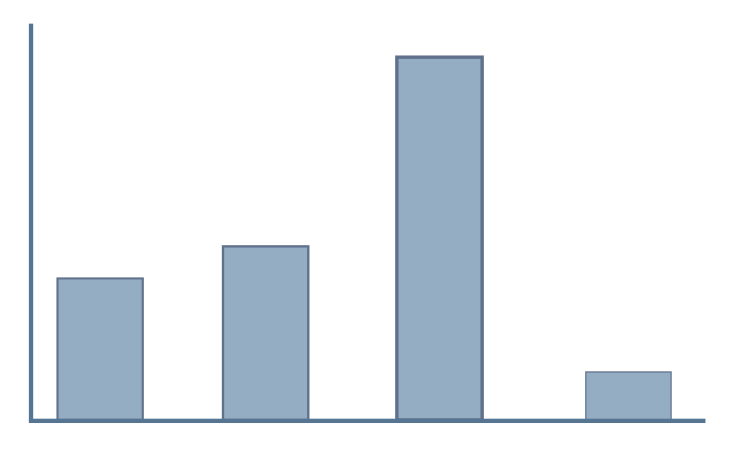
You may notice that some datasets are displayed with bar
charts and others with line graphs. This depends on whether
the expression data describes a categorical variable
(tissues, treatment etc.) or continuous variable (days,
temperature etc.).
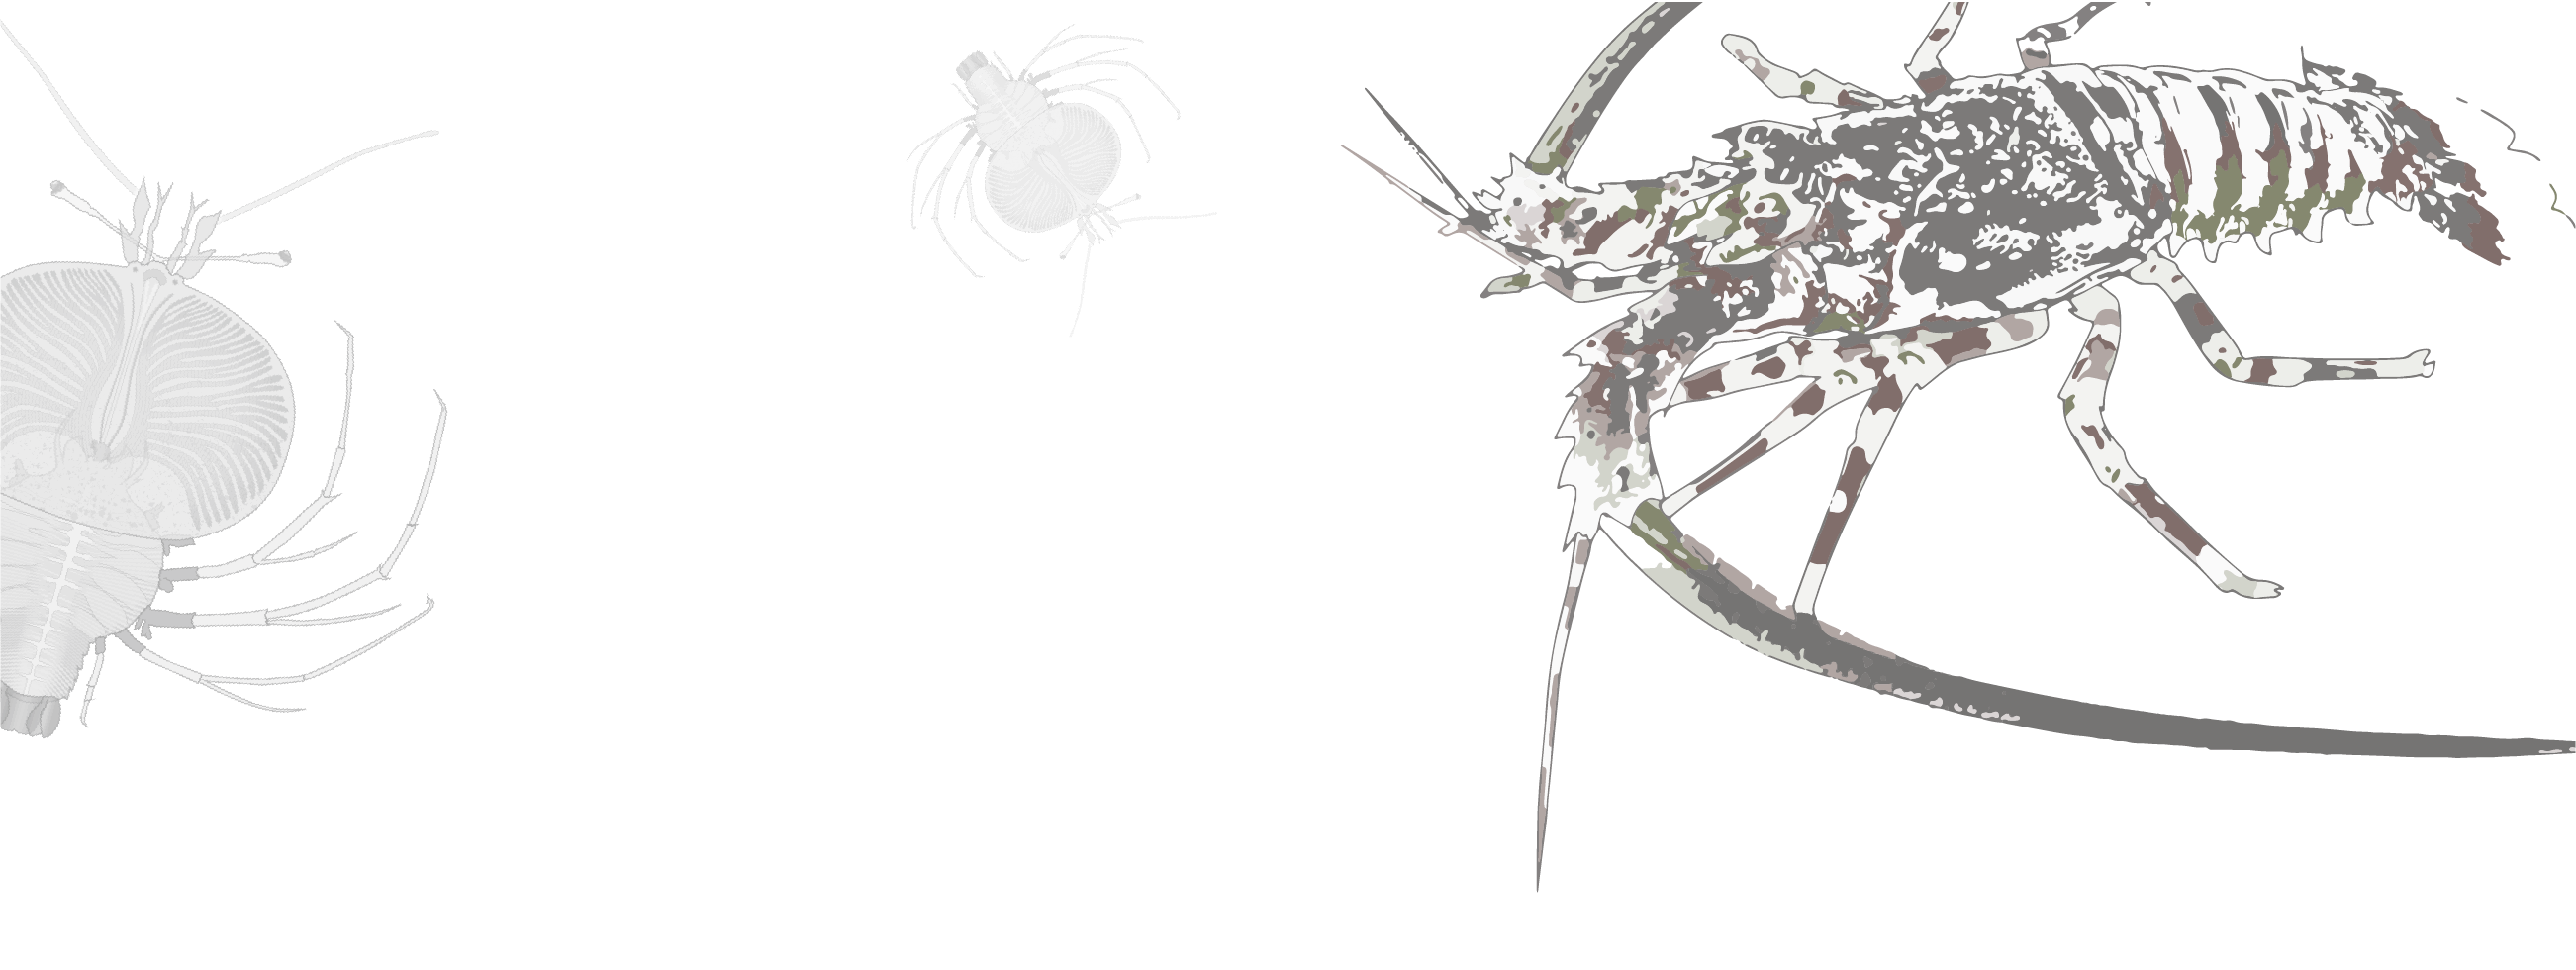
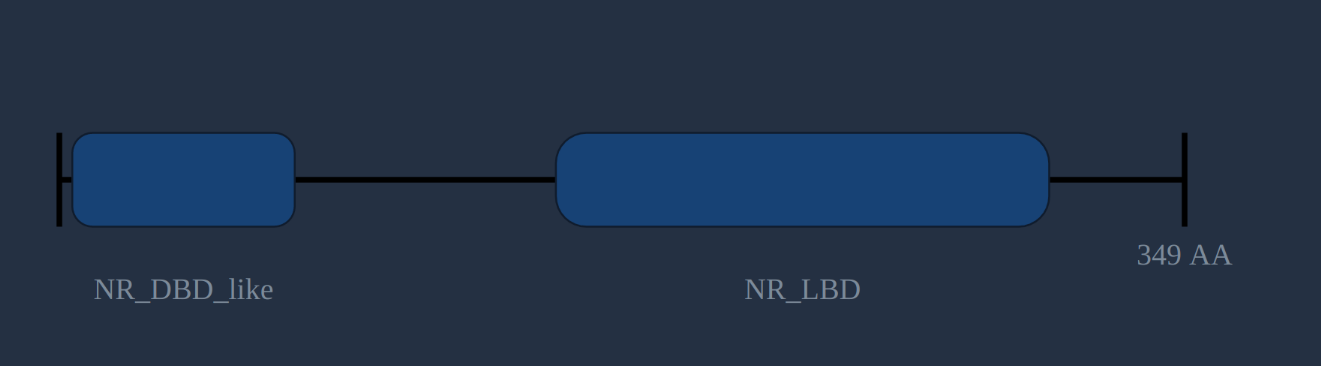
The protein structure pane
The structure pane shows the protein length predicted by TransDecoder, with conserved domains (predicted by the NCBI's CD-search ) plotted along its length. Domains are linked to their descriptions in NCBI, PFAM, TIGRFAM and other databases which can be followed by clicking on them. Not all transcripts will have a predicted protein, and not all predicted proteins will have predicted domains. However, if you know what structure to expect (like the nuclear receptor DBD and LBD in the protein on the right) it can be a good indication of a correct and complete sequence.
Downloading sequence data
Plots and sequences from the results page can be downloaded in bulk.
Select transcripts of interest in the match list
As you browse matching transcripts, you can select any that
seem interesting with the checkboxes on the right of the match
list.
Once you're happy you've got all the interesting matches, click
the download button above to open the download dialog. The
download button from the BLAST app is shown in the top image.
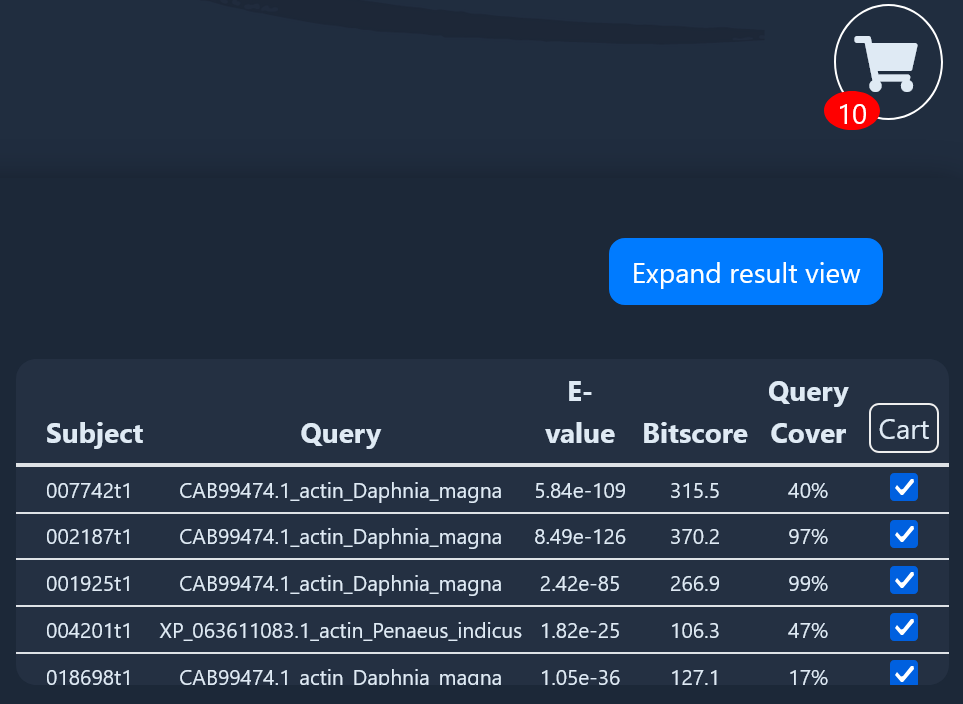
If you're using the CrusTome BLAST tool, selecting transcripts
using the checkbox will add them to cart (bottom image). Click on the cart to
see the "Download All" button.
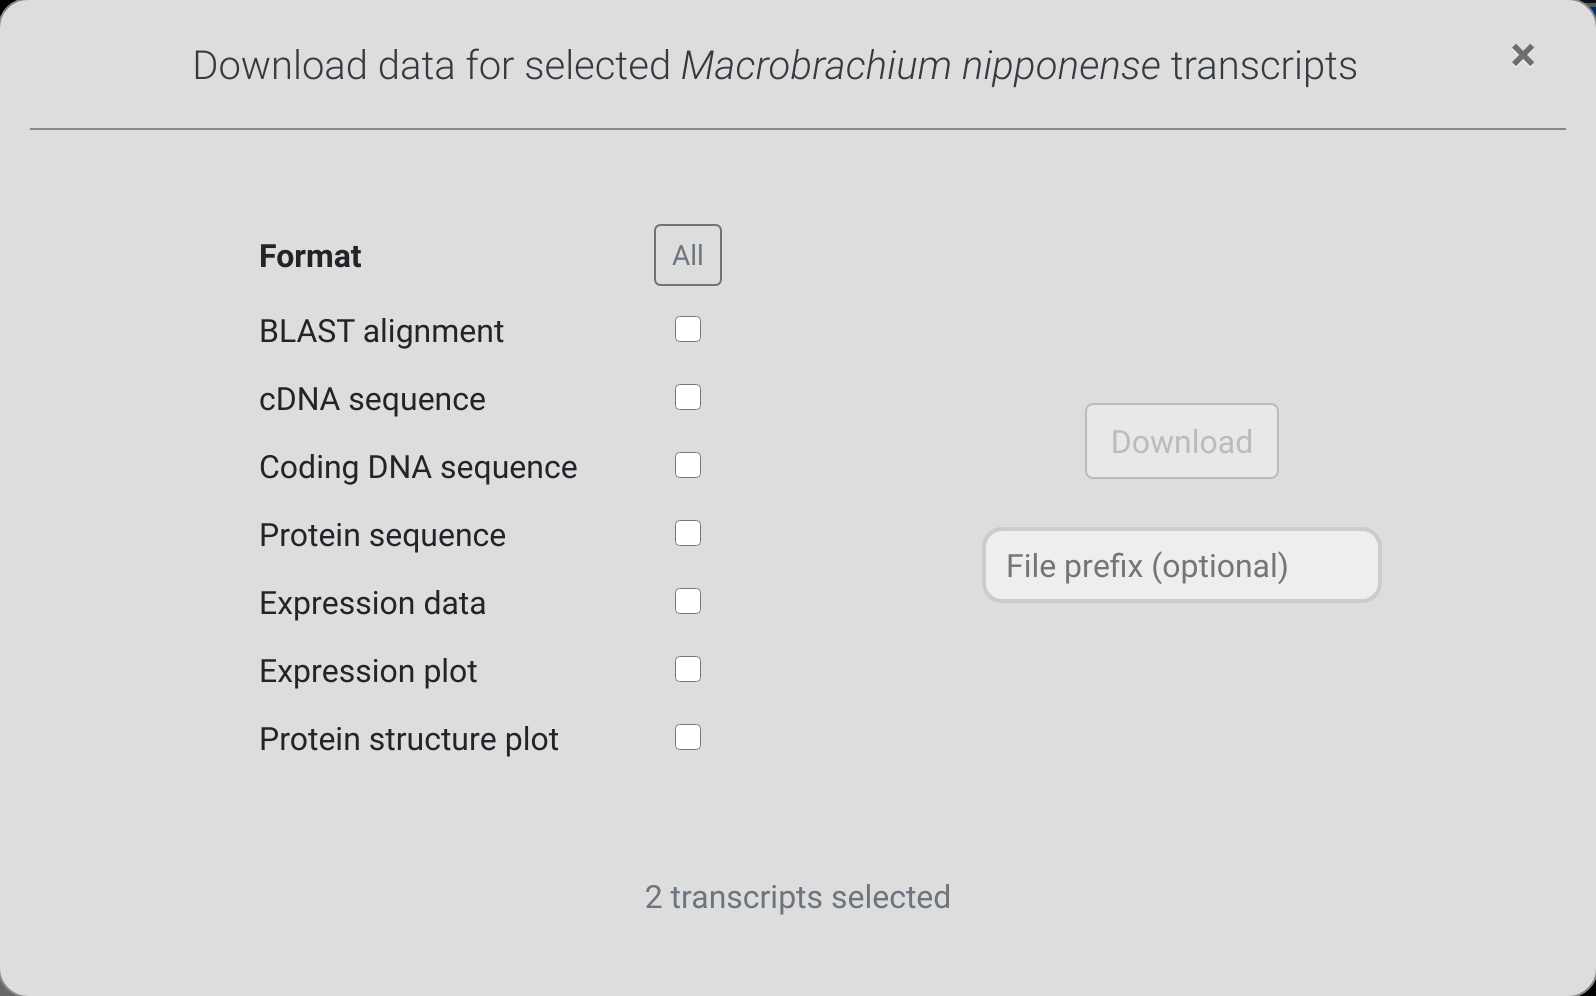
The download dialog
Simply select the formats that you wish to download and click
the download button. For community datasets, the available
formats depend on whether the owner of the dataset allows
full or only partial access.
It may take up to several minutes to render the requested
files if many formats and transcripts are selected.
You optionally add a file prefix. This will be used to name the
downloaded file, so you can remember the origin of these files
later on. For example, entering "myresult" will lead to
downloading a file called "myresult.zip".
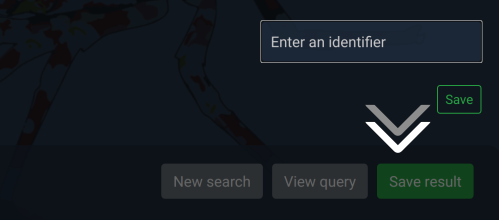
Saving results
If you are a registered user, you have the option to save results
that might be useful in the future. When logged in,
you should see a "save" button in the top-right. Click save,
enter a useful identifier (so you can remember what it is) and
then click save or hit the enter key.
You can then return to this result at any time through the
saved results
page of your user profile. CrustyBase will store a maximum of
200 saved results. When this limit is reached, further
saves will begin overwriting the oldest save.
You can also view and revisit all results from the past 7 days
in the "BLAST history" panel at the bottom of your
dashboard.
Please note that this history does not apply to CrusTome BLAST
results.
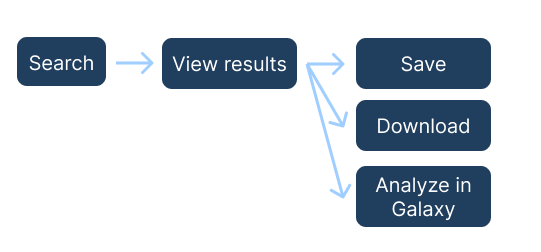
CrusTome BLAST
CrusTome BLAST overview
The CrusTome BLAST tool allows users to search for their query sequences in CrusTome datasets. The search, view results, save results, and download functionality is similar to the BLAST tool. Please see the BLAST search section of the guide for more details about these steps. The "Analyze in Galaxy" step is unique to the CrusTome BLAST tool and is explained more below.
Analyze in Galaxy
You can use the "Analyze in Galaxy" option if you would like to perform alignment and phylogeny in Galaxy using the sequences that you have selected from CrusTome.
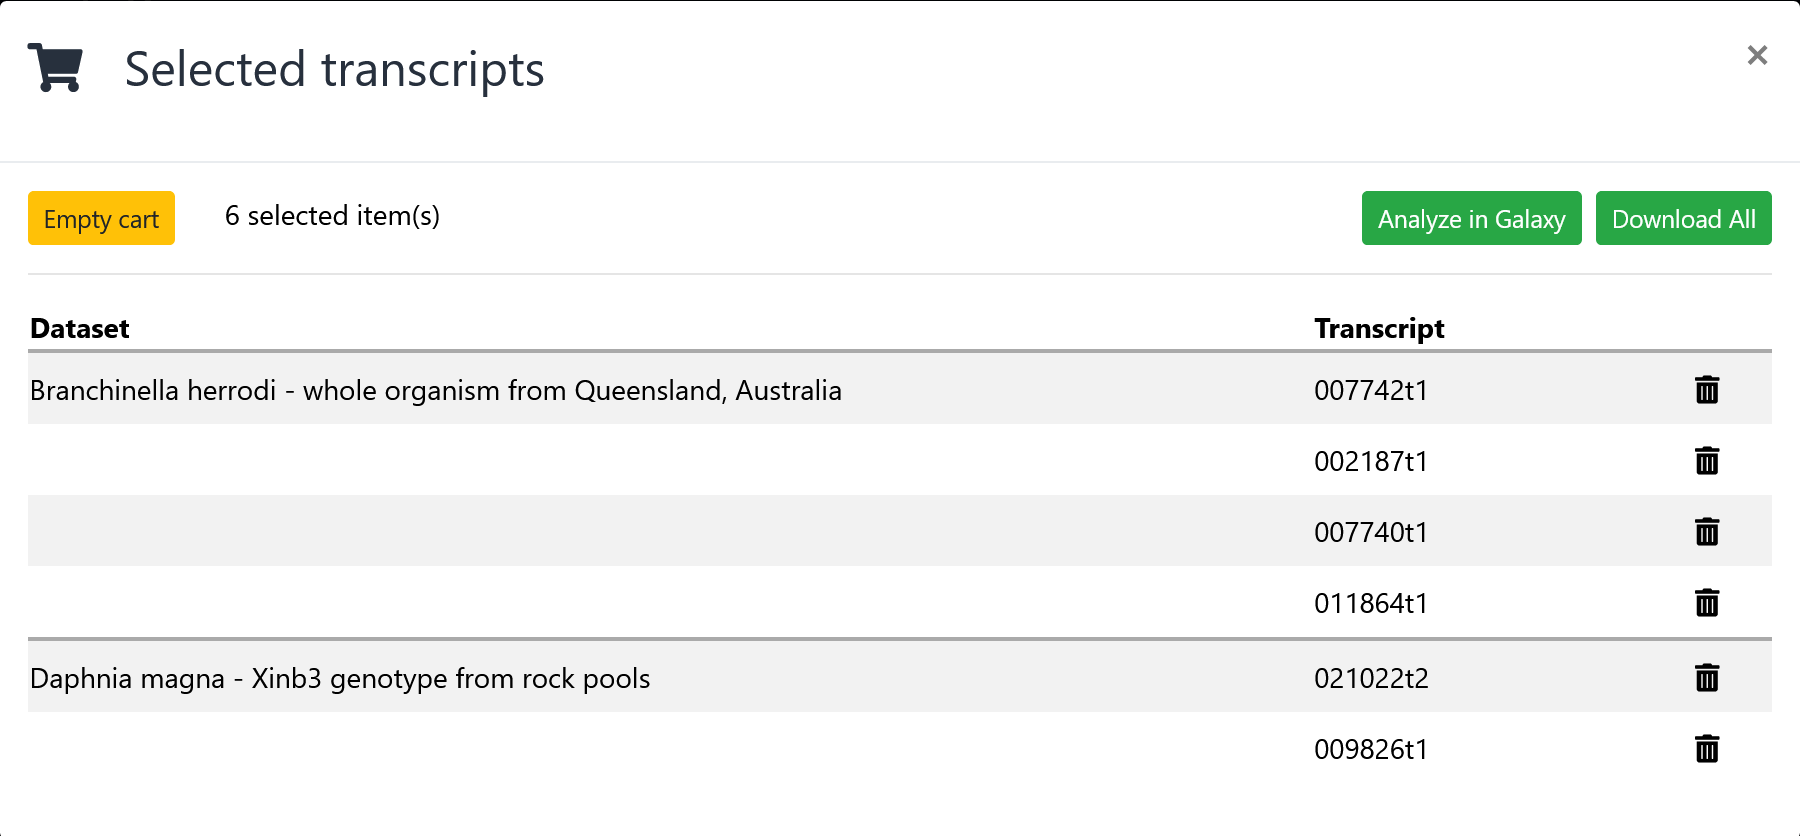
View the cart
From the results page, click on the cart icon to view all the transcripts in the cart. This icon is only visible if you have selected one or more transcripts using the checkbox. From the cart, click on the "Analyze in Galaxy" button to proceed to the instructions for utilizing Galaxy.
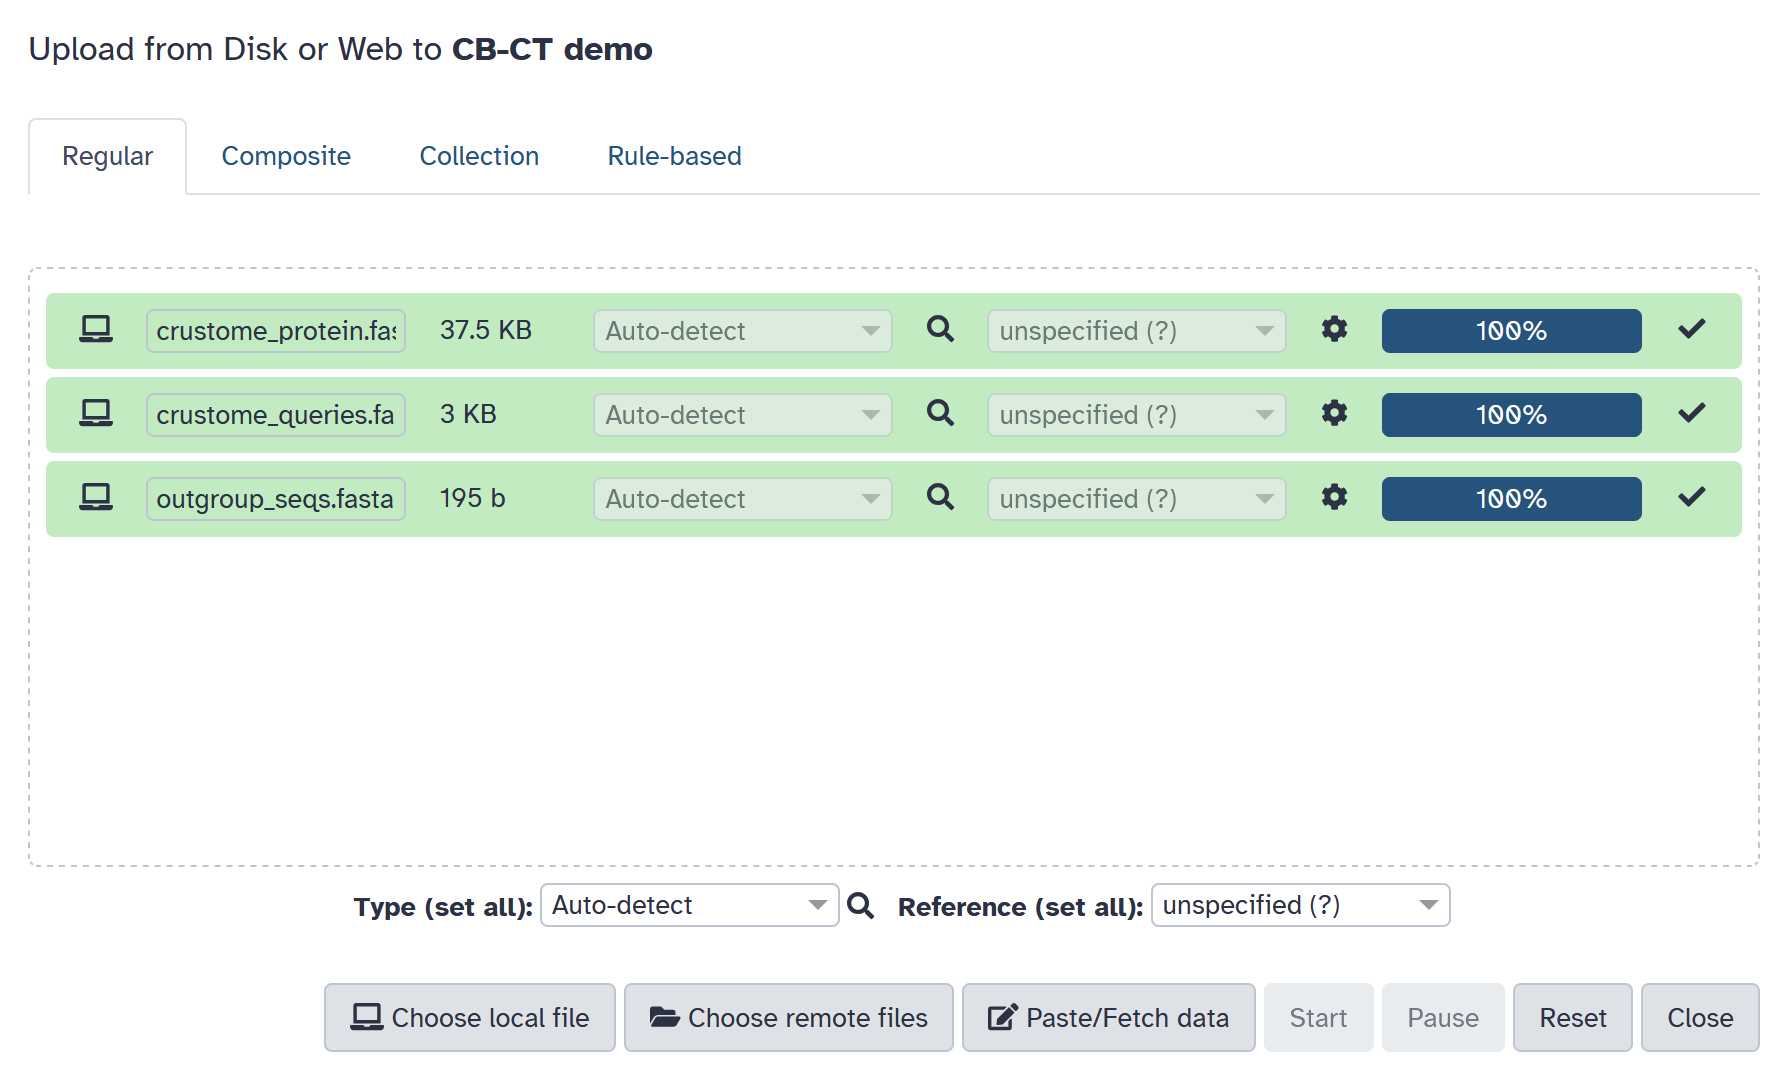
Prepare input files
Three FASTA files are needed to run our Galaxy workflow: amino
acid sequences from CrusTome, amino acid sequences from your
query sequences, and outgroup amino acid sequence/s.
The first two inputs can be obtained by clicking "Download
CrusTome Files" and unzipping the downloaded folder. The
outgroup sequence/s which will be used for rooting the
phylogenetic tree can be obtained from the
NCBI website .
Please create a FASTA file with sequences suitable for your
analysis. This can be done by using a text editor.
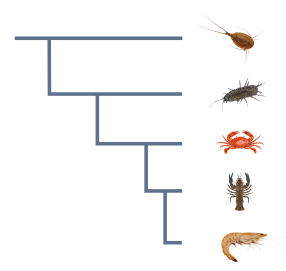
You can choose outgroup sequences based on established
evolutionary relationships from the literature. Outgroup
sequences should be related enough to your ingroup
(group of genes and species that you're studying) so that you
can confidently align the sequences, but distant enough that
it clearly branches off before the diversification of your
main group of interest. For example, if you are studying genes
in Malacostraca, sequences from Hexapods may serve as an
outgroup.
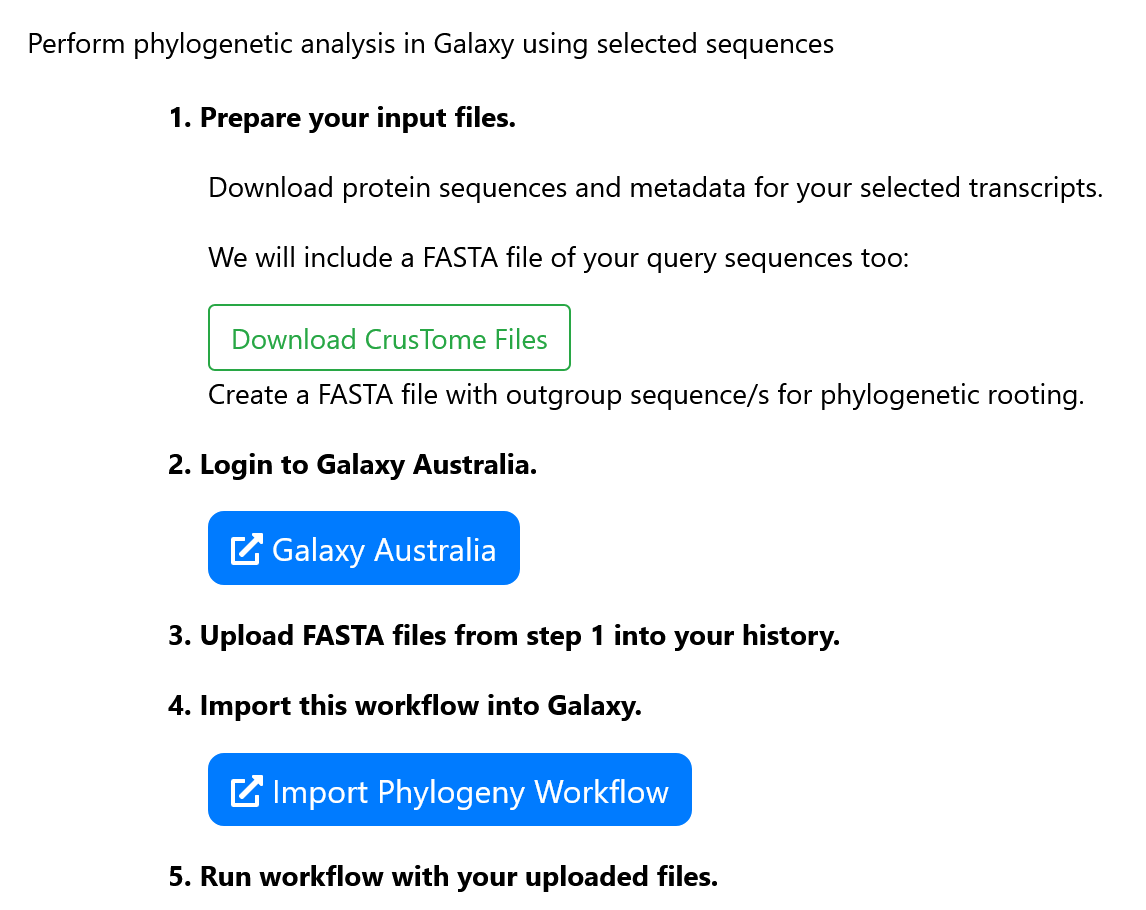
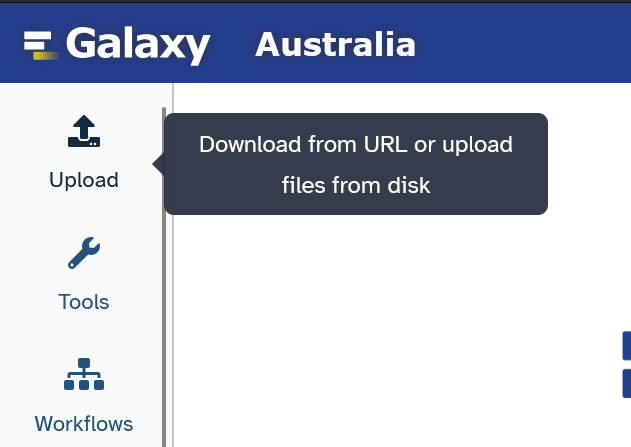
Go to Galaxy
Go to
Galaxy Australia
and login. Currently, our workflow is only available on this
server, but we aim to make it available on other servers in
the future.
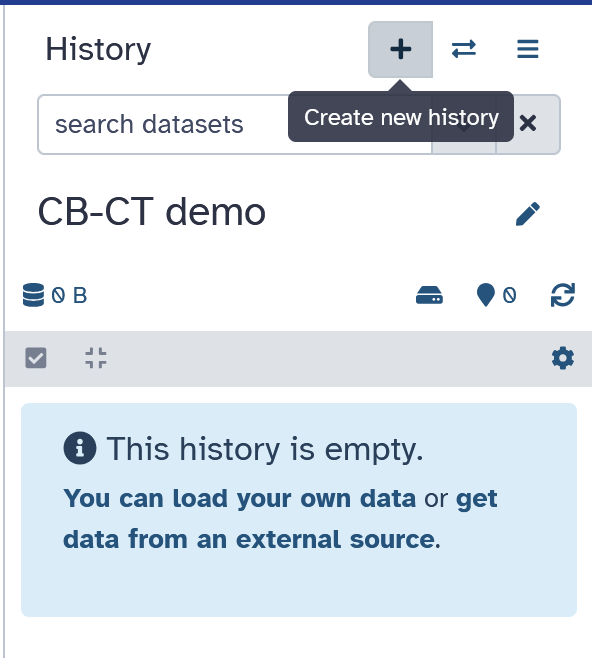
Click on the plus icon near the top right corner to create a
new history.
Upload input files to Galaxy
Click on the "Upload" button on the top left corner to bring up the upload dialog. Drag and drop your FASTA files there and click "Start" to upload them to your new history. Click "Close" to close this dialog.
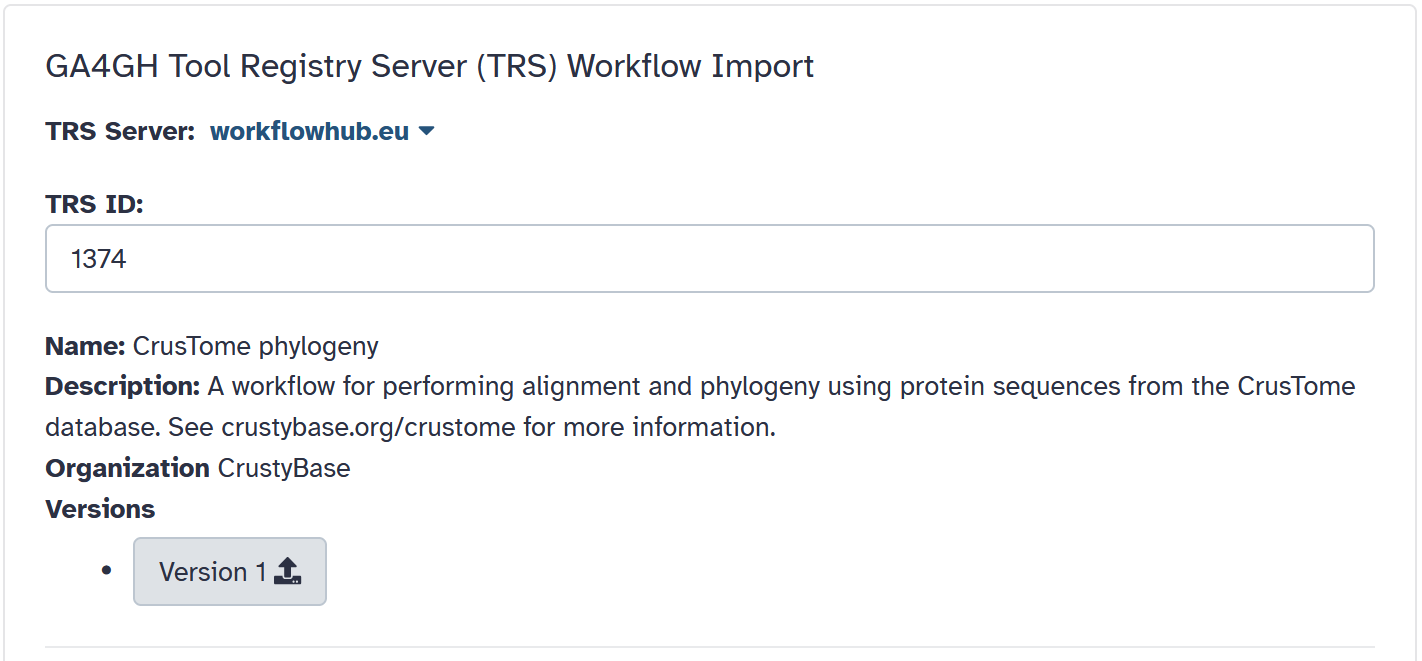
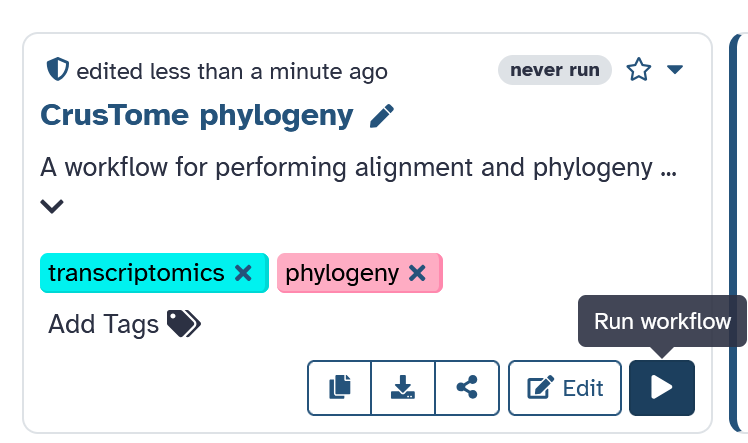
Import workflow to Galaxy
Click on
"Import Phylogeny Workflow"
and then click on "Version 1" to import the workflow.
Next, click on the "Run workflow" icon on the bottom right.
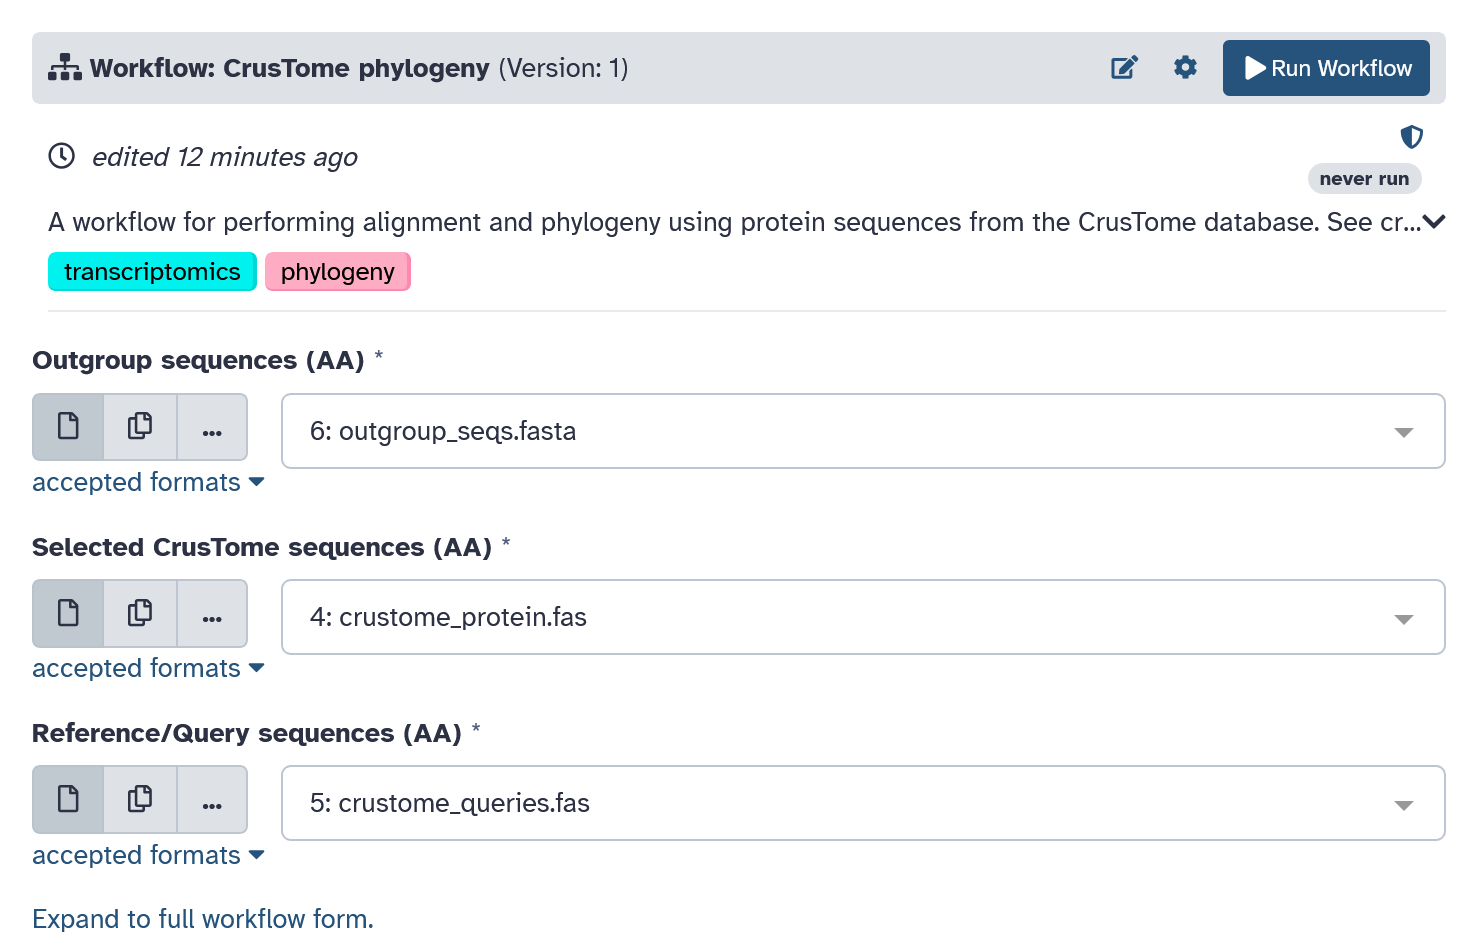
Run workflow
Select your input FASTA files and then click the "Run Workflow"
button on the top right to run.
The following steps will be performed by the workflow:
Examine outputs
The outputs will be available in your history. Notice the
icons under each item in the history. You can click on the "i"
icon (third icon) to view details from the tool
execution. You can use this to examine the standard error and
output. For MAFFT, this can be helpful for seeing which
strategy was selected by the tool for performing alignment.
We recommend examining the alignment files produced by MAFFT
and ClipKIT. You can do this in Galaxy by clicking on the
visualize icon which is represented with a bar chart
(fifth icon). Alternatively, you can download the file using
the first icon and then open it with a tool such as
Jalview.
Similarly, the maximum likelihood tree produced by IQTREE can
be visualised in Galaxy. Alternatively, you can use a tool
such as
iTOL.
After examining the outputs, you may wish to remove some
outliers or duplicate sequences and rerun the workflow.
User accounts
You don't need to be registered to use CrustyBase, but it does come with benefits!
When you create an account with CrustyBase, you will be able to save BLAST results and view your search history. You can also create groups and upload your own transcriptome datasets. It's free to register and always will be.
Account overview
The
dashboard
gives you a brief overview of your account. This page allows
you to edit your personal details,
view your groups and datasets, view recent search history and
delete your account (why would you do that!?).
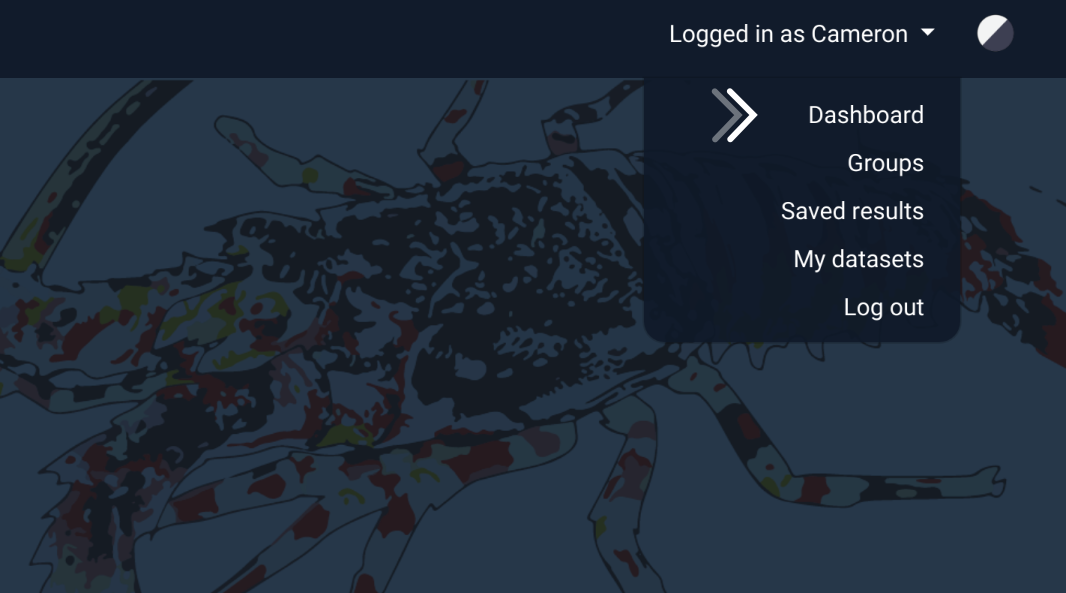
When you are logged in, the dashboard and other
pages related to your account can be found by clicking on the
login prompt in the top-right of any every page, as shown on the
right.
Groups
Groups control access to transcriptome datasets.
There are two situations when you might need to make use of groups:
- You are going to import a dataset
- You want to get access to a colleague's datasets
You can manage groups through your user profile.
Data access
The purpose of groups is to control data access.
Not all datasets are fully accessible to the public, but the members
of a group always have full access to that group's data. Groups
are designed to reflect data ownership in the real world - datasets
are typically owned by a research group, not by a single person in
that group.
You can still view and search restricted datasets,
but you cannot access or download
raw sequence or expression data. The purpose of this is to
encourage sharing of datasets which are restricted by intellectual
property rights, since graphical results are usually
insufficient for published research.
If you find something of interest in these
datasets, we encourage users to look up the owner of the dataset
and seek collaboration. You can find out who uploaded the
dataset by checking the dataset's profile in the
data browser.
Create a group
The only time you might need to create a group is when you are
going to import a dataset. You can also consider joining a
colleague's group and importing the data to there, if you wish to
share access. However, if you are going to import publicly available
data, you can simply opt to import the dataset into the
Public Domain instead.
You can create new groups in the
group management
page, which is accessible through the login prompt in the top-right.
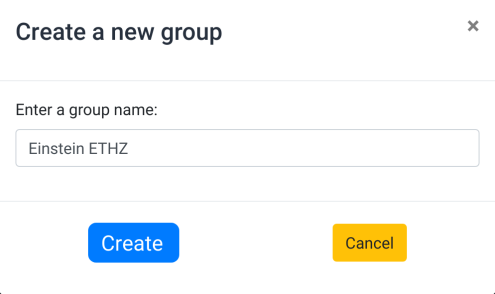
When creating a group, think of a name that is descriptive and
unique. For example, Albert Einstein's research group at ETH
Zurich might be called "Einstein ETHZ".
Join a group
If a colleague has a research group that you wish to join, they
will need to send you an invite. This can be done easily by
visiting the
group management page.
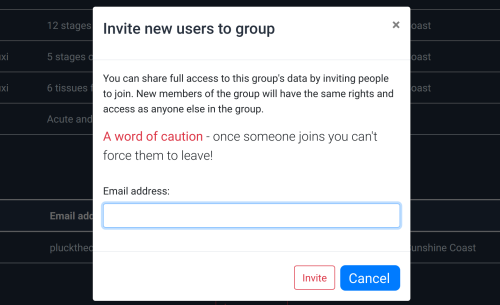
Simply select the appropriate group and hit the "invite" button.
Enter the email address of the person you wish to invite and
they will be sent a link to join the group.
Check the email address carefully - once someone joins there is
no (easy) way to remove them from the group.
Leave a group
There are situations where you may want leave a group - perhaps
the group is redundant or you are leaving an institution. Simply
select the group on the
group management
page and select "leave group" at the bottom of the page.
Consider this carefully though. Once you leave you'll lose access
to the group's datasets and, if you were the last member in the
group, the group and all its data will be deleted. This is the
only way to delete a group.
Import data
Why import data?
There are a number of reasons to import data into CrustyBase.
The most obvious reason to contribute your data is because it is
the right thing to do! We are all in the business of advancing
global knowledge, and the process is far more efficient when we
work together.
Aside from that, there several benefits of having your
data in the hands of CrustyBase:
- CrustyBase is a free service for navigating your transcriptome data.
- You and your research group can access your data wherever you are.
- Increase your exposure. Make collaborations, get citations.
Prepare an import
You can find the
data import app
in the data tab in the navigation bar.
There are three phases to the data import process:
- Metadata input (dataset information and access level)
- File upload & validation
- Review & submit
Public access level
Full access allows any user of CrustyBase to download raw sequence and expression data from any transcripts that they find. This data might be sufficient to publish findings on CrustyBase.
Partial access restricts the data types that a public user is able to download, allowing only graphical content to be seen. Given that publication typically requires reporting of original data, users who wish to make such use out of these datasets would be expected to contact the dataset owner to seek collaboration.
All members of the group owning the dataset have full access, including permission to edit and delete the dataset.

File upload
Upload files must be
correctly formatted for the server to parse them correctly. If
there is a problem validating the data, you will be given a
useful message to help fix the problem. It should be possible
to make any formatting changes with conventional spreadsheet
and text-editor software.
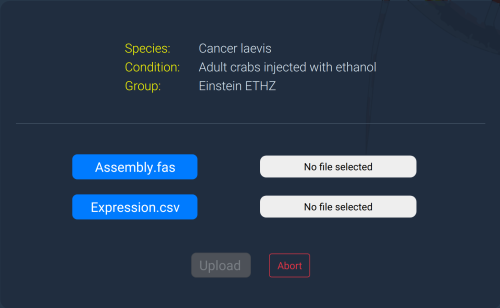
There are two files that need to be uploaded:
- Transcriptome assembly in FASTA format
- Expression data in CSV format
These files are limited to 1000MB each.
Assembly file
The assembly file should be a FASTA-formatted sequence file.
Each sequence should start with a title line, beginning with
an angle bracket ">" and a new line. The following sequence
should be composed of only the characters "ATGCN" and new lines.
The title can be no longer than 25 characters for any given
sequence - any longer than this is unnecessary and makes them
difficult to display on CrustyBase.
In the FASTA
file on the right you can see that the first sequence title (green)
is an appropriate length and format, whereas the second sequence
title (red) has been appended with surplus information by the
assembly software. This additional information needs to be
removed.
If you are unable to reformat the sequence titles,
try uploading the file with the "Reformat contig IDs" option
enabled. Please note that you will have no way to link CB
results to your local dataset if you choose this method, as
the contig IDs will no longer match.
CGACACCCAGAAGGGCCTGCAGCACGCCATGATGCAGATGAACGGCCCGATGATGGAAGG ACGTCGCCTGGATCTGCGCGATGATCCCGCATCACATGGGCGCCATCGCCATGGCCCAGG AATCCCGAGGCTAAGAAGATCGCCGAGAAGAGCATCCAGGAACAGGAGAAGAGCATCAAG
>comp3_c0_seq1 len=319 path=[12086:0-74 3106:75-318]
ATCTGTTTCTCCTTTTCATATTTTTCTTTTCTTTTGTTCCCTGTGTTCCACTTCTCTGTC CTTTCACTTCCCTCCTTCTCTTCCTTCTGTTTATTTGCTTCTTCTTCAGTATCCTTTCTT CCTCTTTTCCTTTTCCCTTCGCATCTTTCTCTCCTTCTTCTTTCTCTTCATCTATTCCTT
Expression file
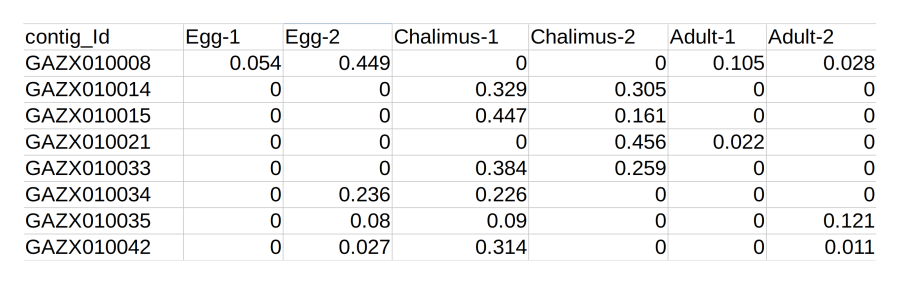
The expression quantitation file should be a plain CSV file.
If the samples were sequenced with replicates, makes sure that
this file includes the raw replicate data and not mean data.
The file on the right shows how the data should be formatted.
Contig IDs in the first column should match those in the
assembly file, otherwise there is no way to connect the two
together!
It may be helpful for you to label the column header with
meaningful names, but these will be discarded when the dataset
is imported. Column names are taken from the "Series labels"
field during Metadata entry.
We highly recommend that you use RLE, TMM or TPM as
units of transcript expression, though there are other
metrics that can be used. For more accurate quantitation it is
often better to map reads to the CDS (coding DNA sequence)
rather than the entire transcript, as this results in a more
uniform distribution of read mapping.
Restrictions
There are several restrictions on data imports which may prevent some datasets from being imported.
Comparable samples
The transcriptome must have originated from sequencing multiple
samples that can be compared. Some transcriptomes are generated
with only one sample feature without examining any variables -
these datasets are not suitable for CrustyBase because there is
no expression data to compare. An example would be a
transcriptome of brain tissue which includes no other
features for comparison.
CrustyBase is designed to show experiments where transcript
abundance has been estimated across a number of features, for
example brain, gonad and muscle tissues. In this case, we would
be able to visualise the difference in transcript abundance
between these three tissues.
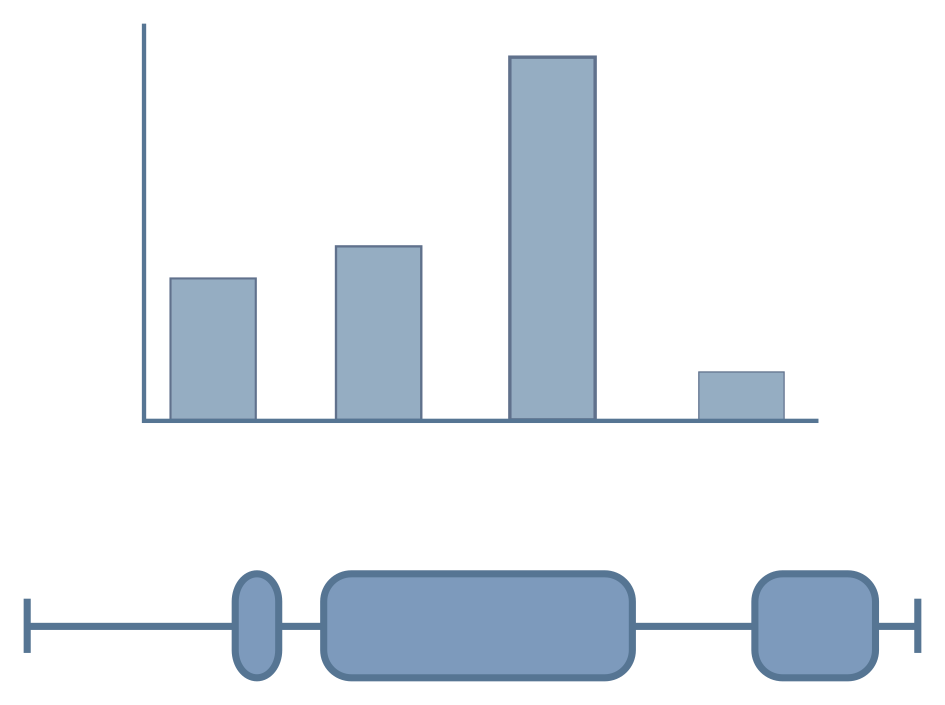
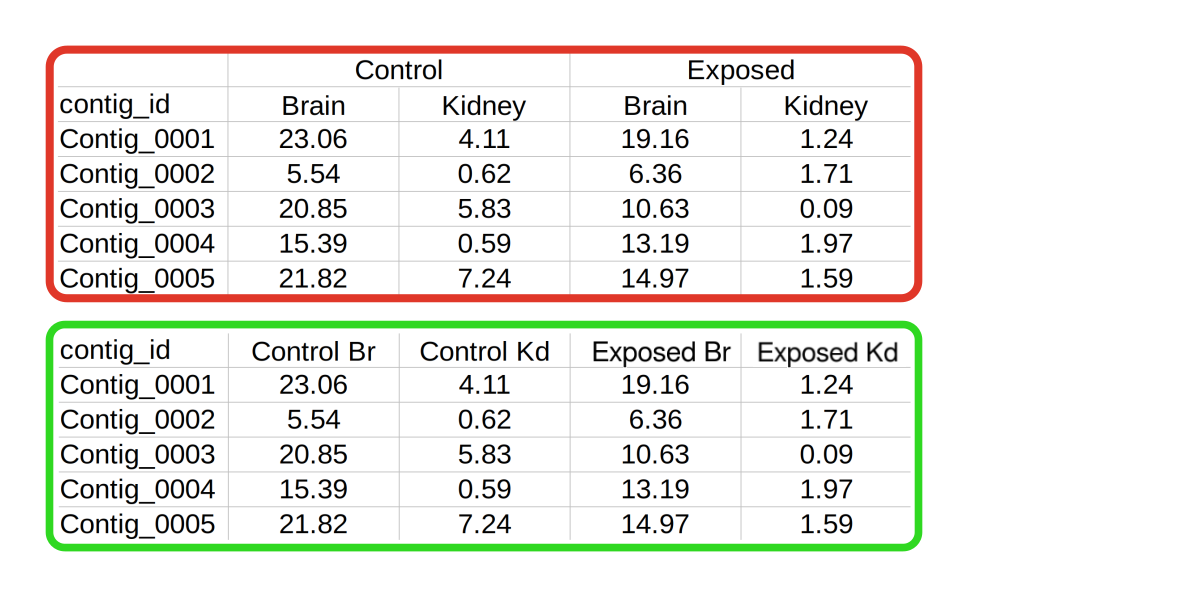
Feature levels
Features describe the variable(s) compared in an RNA-seq experiment.
Example features could be tissue type, developmental stage
or experimental treatment. However, some experiments define
multiple feature levels.
An example of this is shown on the right (red box), where samples have been taken from two different tissues under a control and treatment condition. In order to import this dataset, these features would need to be flattened into one level, as shown on the bottom panel (green box).
File size
Uploads have been restricted to a maximum file size of 1000MB to preserve server resources. If this limit prevents you from uploading a genuine dataset, please let us know by leaving some feedback . We can raise this limit if necessary.
Delete a dataset
There are a number of reasons why you might want to remove a dataset from CrustyBase. Any member of a group can delete any dataset under that group's ownership. Find the dataset under My datasets. On the profile page you will find the option to delete at the end of the Details section.